
What is a business intelligence dashboard?
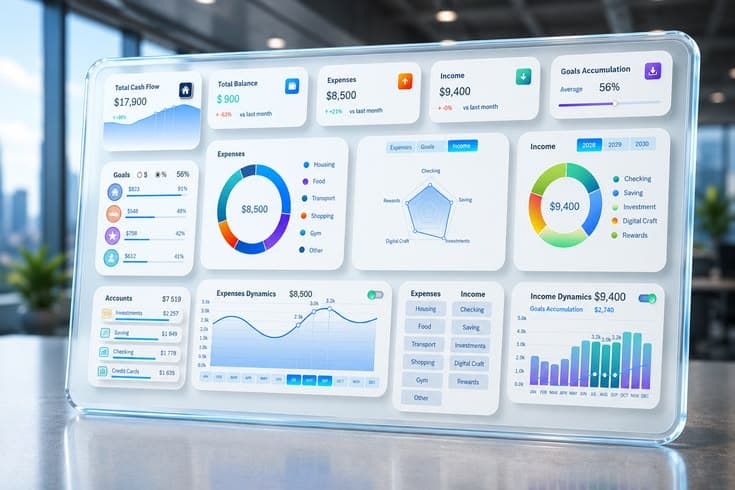
"BI dashboard" gets thrown around as if it's a single, obvious thing—but most people picture something closer to a fancier spreadsheet, and that undersells what it actually does. A business intelligence dashboard isn't just a nicer-looking table of numbers. It's a live view into your business that updates as new data comes in, built so anyone can understand it without needing to know how to write a formula.
What makes a dashboard different from a spreadsheet
A spreadsheet is a snapshot. Someone pulls the numbers, builds a table, maybe adds a chart, and shares it—and the moment it's shared, it starts going stale. The next version means someone repeating that same manual process, often introducing small inconsistencies each time: a different date range, a missed transaction, a formula that got overwritten.
A dashboard is connected directly to your underlying data—your sales system, your accounting software, your database—so it reflects what's happening now, not what was true when someone last exported a file. Refresh it, and the numbers update. No one has to remember to rebuild it every week.
What a BI dashboard is actually built from
Underneath the charts, a dashboard is really three things working together: a data source it pulls from, a set of calculations that turn raw records into meaningful metrics, and a visual layer that presents those metrics in a way that's fast to read at a glance. The value is less in the visuals and more in getting the first two right—if the underlying data is messy or the calculations are wrong, a beautiful dashboard just makes the wrong numbers easier to trust.
Who actually needs one
A dashboard isn't only for large companies with dedicated analytics teams. It becomes useful the moment a business is making the same decision repeatedly—weekly stock reorders, monthly staffing plans, daily cash-flow checks—and that decision currently depends on someone manually gathering numbers each time. A few common signals it's time:
- You ask "how are we doing?" and the honest answer is "give me a day to pull the numbers"
- Different people quote different figures for the same metric
- Reports take hours to assemble and are outdated by the time they're shared
- You're making decisions based on gut feel because getting the real numbers is too slow
- You have more than one system (POS, accounting, bookings) and no single view across them
What good dashboards actually show
A common mistake is cramming every available number onto one screen. A dashboard that tries to show everything ends up showing nothing clearly. The better approach is to build around a small number of decisions the dashboard needs to support, and keep only the metrics that inform those decisions front and center—everything else can live one click deeper for when someone wants to dig in.
For most small and mid-sized businesses, that means separate, focused views: a sales dashboard for revenue and top products, an operations dashboard for stock and delivery times, a finance dashboard for cash flow and outstanding invoices—rather than one crowded screen trying to serve everyone at once.
What it takes to build one properly
The tooling—Power BI, Looker Studio, or a custom-built dashboard—matters far less than the groundwork underneath it. Before any dashboard is worth building, the data behind it needs to be centralized and reasonably clean, and someone needs to have actually defined what each metric means (does "revenue" include tax? does "active customer" mean bought this month, or this quarter?). Skip that step, and the dashboard just displays disagreements faster.
A BI dashboard is worth building the moment a decision is being made repeatedly and slowly. It won't replace judgment, but it removes the delay and disagreement that come from everyone working off different, manually assembled numbers—so the conversation can start from what's actually true, not from whose spreadsheet is right.
Not sure which category your problem falls into?
Tell us what you're dealing with in plain language—we'll help you figure out what's actually worth building.
Start a conversation